Gitea: Poor page load and download times for some countries #24
Labels
No Label
Service
Buildbot
Service
Chat
Service
Gitea
Service
Translate
Type
Bug
Type
Config
Type
Deployment
Type
Feature
Type
Setup
No Milestone
No project
No Assignees
6 Participants
Notifications
Due Date
No due date set.
Dependencies
No dependencies set.
Reference: infrastructure/blender-projects-platform#24
Loading…
Reference in New Issue
Block a user
No description provided.
Delete Branch "%!s()"
Deleting a branch is permanent. Although the deleted branch may continue to exist for a short time before it actually gets removed, it CANNOT be undone in most cases. Continue?
Developers from US and Canada reported:
Some difference is expected but this much indicates there is a problem somewhere.
Developers being able to efficiently use the website is important for productivity, so marking this as a bug.
I know @dmcgrath looked into this a bit in chat. Not sure if this was fully explored, if there are still things to check, if @Arnd has looked into it, or other people need to get involved for advice.
It's pretty gnarly here in western canada
And just to validate my connection is fine
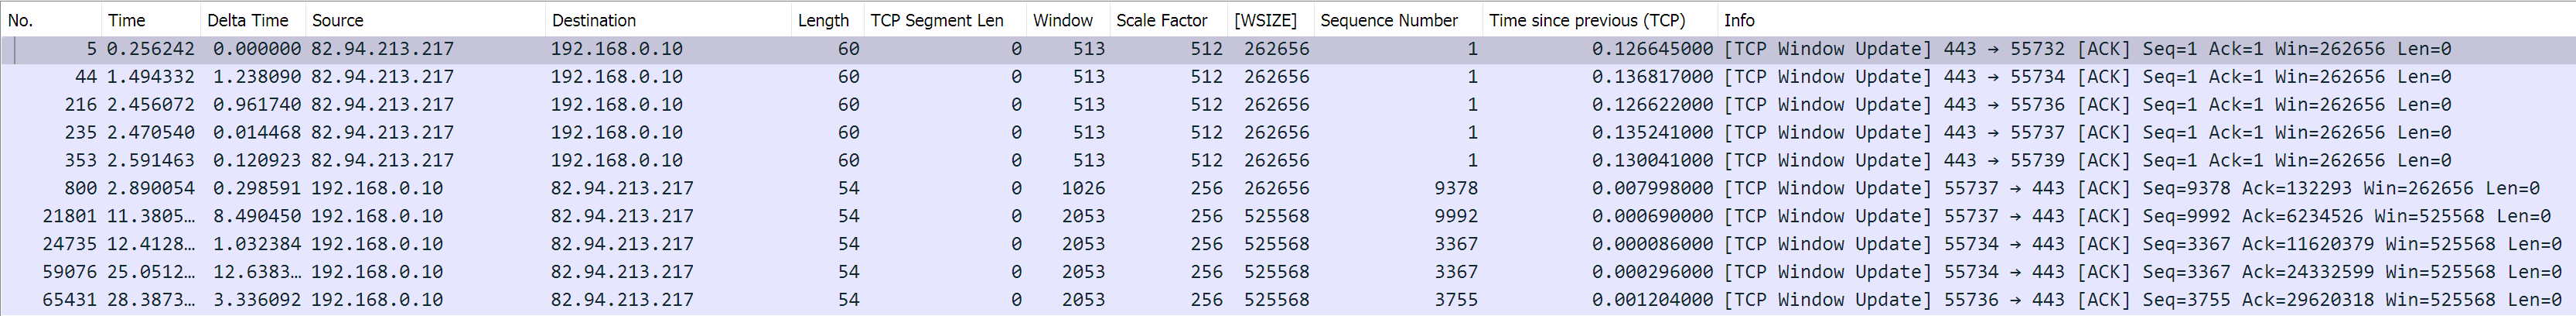
I have packet captures of both (project.blender.org and git.b.o available privately on request) it appears the conversation with
git.blender.orguses much larger TCP Window sizegit.blender.org
projects.blender.org
There's also some packetloss and retransmissions going on this happens on both projects.blender.org and git.blender.org. I have a capture from june last year when we were looking at svn.blender.org which does not exhibit this problem (but does now) so this appears to be something new affecting all traffic coming from b.org to me
Brecht Van Lommel referenced this issue2023-02-13 16:17:54 +01:00
Last weekend when I took a quick peek into this problem, it was found that git checkouts gave results that were fastest in the same rack/network as the VM of gitea.
Performance at home was ~300kb/sec doing a git clone of blender. From Scales (across the 2x1G etherchannel) is 3-5MiB/sec. From the Archive jail I got 17.63MiB/sec, which is in the same 10G network as the Gitea VM.
Unfortunately, there has been constant 600G archives across that link the last week or so. I've had to redo the 600G archive backup multiple times due to changes in the repo from Sergey adjusting and rebaking, mostly since I had to go from a tarball to an rsync (which has too long filename issues), and today back yet again to a tarball to a non archived (offsite) copy on the NAS.
In addition, the storage for gitea has been getting swamped due to backups also backing up to the NAS all of the temporary directories, which has been so unexpected that it filled the storage for the VM at least 3 times this weekend.
Add on top of this the daily backups to the studio, general outbound traffic, rsync's of svn and similar to the studio, and it's just been, generally a bad week or two to look into problems since there are many factors to consider.
Below are some of the sysctl's that we use for the machine:
Looking at his tcp graph, the window size looks to be staying suffiently above the transfer. I don't know what his receive window was like at the time, or what the server disk I/O was like, but there could have been some bottlenecks between our switches. It is only 2x1G ether-channel after all.
That said, I can take a look at the link closer tomorrow and see if I can do anything to help out, but this has been happening with LazyDodo and others for years, before we even had to factor in the ether-channel. I do recall seeing some errors in the SNMP values for the ether-channel, but I may have just got the wrong SNMP OID plugged into Zabbix.
No networking expert so feel free to ignore if this is obvious or wrong.
To me it seems a small TCP window size as found by @LazyDodo is exactly the kind of thing that would lead to a situation where low latency (in Amsterdam) is fast, and higher latency (further away) is slow. Despite there being enough throughput, it would be waiting much longer for confirmation that the TCP package was received than actually sending data, because it's not sending enough data at a time.
Even if the server is doing a lot of things right now, seemingly it's able to respond with reasonable latency and throughput to requests from Amsterdam. Even if some latency or throughput between e.g. switches on the server would be worse than before, I would expect that to add roughly a constant amount of time that is about the same regardless of distance, rather than a multiplicative factor that increases with distance.
Though of course interactions between many components can have complicated effects, it's configuration like TCP window size that seems like it should be the first suspect.
Just to chime in with a status update, I gave @Arnd a shell here on a VM he can use for some tests and packet captures, since our availability overlaps by only 2 hours a day which wasn't allowing for much time in a day to run diagnostics.
fingers crossed!
In terms of network statistics, I took another look at the switch that directly connects to the ISP. There are (still) tons of errors from the server where Phabricator/Git/Svn/Buildbot run, but this has been known and reported multiple times a year for about 7 or 8 years now since that server was replaced in the rack when the last R410 died.
Here are the error charts:
Note: port 19 is the public interface for the git/svn/etc that was mentioned above, while port 21 and 22 are the ether-channel interfaces.
Frame Check Sequence errors:
Late collisions:
(none on any interface)
Frame Too Long:
(none on any interface)
Internal Mac Receive errors:
Received Pause Frames:
(none on any interface)
Transmitted Pause Frames:
(none on any interface)
Here are the same charts for the ether-channel to the second (10G) rack:
Frame Check Sequence:
Internal Mac Receive Errors:
Note: For port-channel 5 (LACP between the racks), the charts not displayed are not reporting errors.
Now it would appear at a glance that the Dell switch doesn't like something about the link with such a high error count. That said, port 21 and 22, the underlying interfaces, don't show any errors.
Whatever the problem is, it would seem that it is the connection to port 21. The statistics on the other switch show no errors with anything received, nor any transmit errors.
A quick check of the configuration shows that the 10G switch seems to have the ports configured at 10G rather than 1G. Interestingly, the other ports have "speed 10000" configured explicitly, but the trunk lacks the entire definition. It may be that I presumed it was auto negotiating to speed 1000 since the link "worked", or that I looked (incorrectly) at the interface speed for the link below it in the list.
I tried briefly to set the speed to 1000 but the port-channel refused to come up in an ideal time, but that could be because for some reason the Dell switch LACP priority is set to 1 (it wins) and has a Long LACP timeout.
A few more tests show that the transceiver doesn't appear to like being set to gigabit:
Ethernet1/21 is down (SFP validation failed)I did find a page that mentions a possible quirk of the transceiver where they will not come up properly without being bounced if there is a speed change. This unfortunately is a somewhat lengthy outage. Probably better to do it with more of an announcement to at least the channel and mailing list.
Indeed window size is a problem. There is a recv and a send window size though. If the recv window (LazyDodo) is 0, he would basically be telling us to stop sending. If the sender needs to send more, it would increase the size as needed, but we aren't seeing the window size lines in his graph touch.
I did look more into the interface errors, but this time from the host pov. It would seem that, based on the total interface errors and uptime, we are receiving about 1.173 million interface errors a day on the external facing port for the host that serves svn/git/buildbot/phabricator.
If I were to hazard a guess, I would think that the switch was overflowing the counter and making it seem less of a problem than it actually is, given the host interface errors. My apologies for letting this go so long, but I can't easily walk to the data center :) I poked @Arnd to see about wire replacements for the host ports.
While it's not clear that problem between the two switches is critical or affecting performance in an obvious way, it's clearly not ideal to have one switch try to stuff 10gb/s down the wire at another switch that can only handle gigabit. The fact this link even was in an up state baffles me. It must have slip past my scrutiny! We can discuss this and see about trying to find better transceivers, or gigabit twinax between the racks. Perhaps even expand the LAG from 2 ports to 4 while we are at it to help with the LACP hashing.
I dug a little bit more. I tried different sysctl's on the host, checked the netstat -m nmbcluster values, mtu's, but no matter what I just can't seem to get the window size to go past around 256k on that host, despite sufficient (afaict) sysctl's.
I also dropped over to the GPT bot and tried some question. One this stood out was:
The interesting part that I wasn't considering is that the bandwidth delay product (as referenced in chat at https://www.switch.ch/network/tools/tcp_throughput/?mss=1460&rtt=100&loss=1e-06&Calculate=Calculate&bw=100&rtt2=80&win=64 from chat) seemed to hint that the interface errors we are experiencing may be preventing the window from scaling.
eg:
As well, there is some intentional packet error that we are tossing into the mix via the random early detect (RED) that I enabled on buildbot, svn and git http ports. The gist of RED is that we toss out occassional packets during congestion (key term) in order to help with global synchronization. Unfortunately, disabling RED had no measurable impact on my SVN tests.
Ultimately it seems that we should try to prioritize fixing our interface errors, and proceed from there.
oops, I realize I closed this earlier. I was wondering what happened when I misclicked that!
I have the same problem, but I live in italy
git.blender.org got yanked from underneeth me, and i didn't keep any numbers, but the maintainance done last weekend has improved things on the new server, the old server
iswas still 4x faster.(From @deadpin on chat)
Something is still not right with the new server, also i'm still seeing the packet errors
The weekend work at the data center went pretty good. It sounds like things at least helped.
More specifically, the work to deal with the MAC receive errors by swapping out the 10G SFP+ transceivers with 1G SFP ones, worked perfectly and the errors have disappeared. However, the work errors on Koro's g19 port remain, despite having move it from g19 to g17, and replacing a cable. So whatever the problem was likely is a issue with the NIC itself.
Another thing I noticed while I was filling in some NetBox information for the network was that despite most of the Proxmox nodes having jumbo frames set, and the switches having jumbo frames enabled, most of the interfaces and port-channels I was looking at seemed to have 1500's set. This could potentially be a problem if the hosts are expecting jumbos, but the underlying system isn't allowing it. Although if the VM's aren't configured for anything past 1500 anyway, it may not be a problem is all the services, only some. Possibly HAProxy though.
At some point I will have to dig deeper into this and start slowly adjusting the settings when I get some time. I will let you know if anything changes.
Another data point: from a location in China, Git clone is 20-50KB/s and SVN is 10KB/s. Meanwhile Git clone from GitHub is 5-10MB/s.
Both git-clone and svn-update gets very slow (20-50kb/s) in China.
Thanks for the heads up. Although I think it's pretty much agreed that anywhere beyond the Netherlands is affected.
LazyDodo (in Canada) and I did another round of extensive tests, and found that he was able to push a good few hundred MB/sec to/from us using UDP, but not tcp. We also found that after I capped our 2 primary servers down to around 300Mbit/sec, he was able to get a good 200Mbit/sec and an impressive 8M tcp window size. Then he repeated it again a few minutes later after no changes were made and the speed went back down to horrible rates again. At this time, the entire upstream link went back to a new cap of around 300Mbit/sec. Normally we cap at around 500Mbit/sec.
So without pointing fingers, it almost seems like something upstream of our position is dropping traffic or slowing things to keep us at a steady rate over time. All I know is that it isn't something coming from our end. At least not intentionally! We did have RED enabled on SVN, which itself drops traffic to avoid global synchronization problems, but that should only activate with that host hits its queue limit, which it never gets to.
As for the DC maintenance the other week, Arnd was able to get to the DC and replace the flakey 10G SFP+ with a 1G SFP, which solved the MAC receive errors we got just fine, but this was not a problem. The Koro host was moved to an alternate set of ports, but the errors only reduced, but never disappeared, suggesting a possible problem with the NIC itself. That said, it is a rather low error rate after closer inspection, and doesn't warrant much more work considering that the host is being decommissioned.
Since UDP seems to be a better at maximizing our speeds, I could look into the possibility of enabling QUIC on the Gitea host, but there is nothing I can do about SVN due to that hosts software versions. There is also more of a risk/concern with QUIC/HTTP2, being new and...buggy, in some implementations, which brings security risks, etc.
So for now, apologies for the speed, but I don't know when we will be able to find out what is causing such a horrible experience with our network.
Thanks for the explanation.
Hope it can be fixed otherwise there problem will prevent me, or other devs in China, or from other places to contribute any work for Blender.
This was also reported as a problem now for Arch Linux package building from source.
We indeed know many countries are affected. But I think it's good to know to what extent this is a problem. It was not obvious to me previously that it's gotten to the point that
git clonewith our default build instructions effectively does not work at all for various users and contributors. The workaround for now is using the GitHub mirror.And so knowing that informs where this goes on our list of priorities, and how drastic our solutions might be (like using a CDN or hosting elsewhere).
I think we need to definitively confirm where the problem is located exactly, and go from there. The details of why and how we don't need to post in this issue, the main reason I created it was to gather info from those affected by the problem, and to communicate that it's a known problem and that we are working on it.
I noticed an interesting case when trying to use github mirror for speedup.
The speed is slow(50-80KB/s) as long as I'm using git bash to clone the mirror.
The only case I could get normal speed(10MB/s) is to clone the mirror via Github-Desktop.
This almost sounds like the slow speeds are related to protocol back and forth over a high latency link, versus a blob download that has time to "ramp up" the connection speed.
I finally found out the reason for the slow clone speeds in China.
Our gov has a thing that we call GFW(Great Fire Wall), which blocks/limits access between the internet in mainland China and outside.
I thought that Git shouldn't be blocked since it's a must for programmers. But unluckily, the speed was still limited to about 30KB/s on average.
We usually use proxies to cross the GFW; however, the VPN does not automatically cover the git command prompt.
After setting up proxies for Git by hand, the speed increased to 500KB-1MB/s.
I also manually set a proxy for the SVN to improve the "make update" speed.
For other Chinese friends who have the same problem as I had, I suggest reading the following links:
I still could not fully understand this problem, however.
For example, the fixes I mentioned above were unnecessary before Blender migrated from Github to Gitea. Also, the clone speed from Gitea via Git Bash(500KB-1MB/s) is still slower than cloning from a Github mirror via GitHub Desktop(1MB-10MB/s).
I think I have an idea what is happening there
Can you run
git config --get remote.origin.urlin both clones and show the output?It's been 6 months, i know structural progress takes time, but what's happening in this department?
Last I heard, there was some extra ports enabled in a new rack at the DC awaiting for us to move things, which was planned to be sometime after BCON. Maybe it will help, maybe it won't.
Excellent! thanks for the update!
Poor page load and download times for some countriesto Gitea: Poor page load and download times for some countries@bartvdbraak Buttons are not toys! ;)
Oops! Accidentally hit the close button with that comment! (buttons are toys?)
Glad I’m not the only one capable of fatfingering close buttons!