Metal on Intel iMac with AMD - new questions #116247
Labels
No Label
Interest
Alembic
Interest
Animation & Rigging
Interest
Asset Browser
Interest
Asset Browser Project Overview
Interest
Audio
Interest
Automated Testing
Interest
Blender Asset Bundle
Interest
BlendFile
Interest
Collada
Interest
Compatibility
Interest
Compositing
Interest
Core
Interest
Cycles
Interest
Dependency Graph
Interest
Development Management
Interest
EEVEE
Interest
EEVEE & Viewport
Interest
Freestyle
Interest
Geometry Nodes
Interest
Grease Pencil
Interest
ID Management
Interest
Images & Movies
Interest
Import Export
Interest
Line Art
Interest
Masking
Interest
Metal
Interest
Modeling
Interest
Modifiers
Interest
Motion Tracking
Interest
Nodes & Physics
Interest
OpenGL
Interest
Overlay
Interest
Overrides
Interest
Performance
Interest
Physics
Interest
Pipeline, Assets & IO
Interest
Platforms, Builds & Tests
Interest
Python API
Interest
Render & Cycles
Interest
Render Pipeline
Interest
Sculpt, Paint & Texture
Interest
Text Editor
Interest
Translations
Interest
Triaging
Interest
Undo
Interest
USD
Interest
User Interface
Interest
UV Editing
Interest
VFX & Video
Interest
Video Sequencer
Interest
Virtual Reality
Interest
Vulkan
Interest
Wayland
Interest
Workbench
Interest: X11
Legacy
Blender 2.8 Project
Legacy
Milestone 1: Basic, Local Asset Browser
Legacy
OpenGL Error
Meta
Good First Issue
Meta
Papercut
Meta
Retrospective
Meta
Security
Module
Animation & Rigging
Module
Core
Module
Development Management
Module
EEVEE & Viewport
Module
Grease Pencil
Module
Modeling
Module
Nodes & Physics
Module
Pipeline, Assets & IO
Module
Platforms, Builds & Tests
Module
Python API
Module
Render & Cycles
Module
Sculpt, Paint & Texture
Module
Triaging
Module
User Interface
Module
VFX & Video
Platform
FreeBSD
Platform
Linux
Platform
macOS
Platform
Windows
Priority
High
Priority
Low
Priority
Normal
Priority
Unbreak Now!
Status
Archived
Status
Confirmed
Status
Duplicate
Status
Needs Info from Developers
Status
Needs Information from User
Status
Needs Triage
Status
Resolved
Type
Bug
Type
Design
Type
Known Issue
Type
Patch
Type
Report
Type
To Do
No Milestone
No project
No Assignees
5 Participants
Notifications
Due Date
No due date set.
Dependencies
No dependencies set.
Reference: blender/blender#116247
Loading…
Reference in New Issue
No description provided.
Delete Branch "%!s(<nil>)"
Deleting a branch is permanent. Although the deleted branch may continue to exist for a short time before it actually gets removed, it CANNOT be undone in most cases. Continue?
System Information
Operating system: Mac OS 14.2 (3,6 GHz 10-Core Intel Core i9)
Graphics card: AMD Radeon Pro 5700 XT 16 GB
Blender Version
Broken: 4.1 Alpha (16.12.)
Worked: 4.0 Beta (18.11.)
Short description of error
I am again back to 4-5 times longer render times with the workshop.blend file on my iMac system and
in the latest Blender 4.1 Alpha not even a recognisable image is rendered.
Exact steps for others to reproduce the error
Please read the last post of this thread:
#115134
Actually I have one question and one bug to report if you will call it like that.
I will try to explain.
After I got my iMac fixed and freshly installed a new system on the machine, Blender 4.0 (beta) was back to the normal render times of the workshop.blend file with around 28".
I always keep my system up to date and from time to time I check also the latest Alpha version to compare render times.
Now I am on macOS Sonoma 14.2 (latest) and Blender 4.0.2
The render times are back to over 2 minutes just like before I got the machine fixed. So it seems to be a software issue rather than a hardware issue.
My first question:
Can it be that by trying out new Blender versions that forces the system to re-compile the metal render kernels (partly or all sometimes) that maybe they overwrite each other and this can cause problems?
Is there a place on the file system where these render-kernels are stored? Could I flush the location and force in this way that the render kernels are compiled freshly like they were after the last time when I reinstalled the system?
I was looking on google to find anything how to flush or initialise the MTL-Compiler with no success.
So Blender 4.0.2 is giving me slow render times again which I believe should be fixable.
And my second question is about the 4.1 Alpha.
For a while now the workshop.blend file does not even render an image anymore. See the attached snapshots.
Here my question is, should I use a newer 4.0 blender render scene that I optimised for Blender 4.0 to test my system?
Can it be that the old workshop.blend is also a part of the problem?
Sorry for coming up with the same issue again and again. I know I need to ditch the intel iMac and replace it with an Apple Silicon machine that would fix a lot of the issues I guess.
I Uploaded 4 images:
Usually Cycles kernels are cached in:
/Users/<username>/.cache/cycles.The possible path variants are:
$HOME/.cache/cyclesor$XDG_CACHE_HOME/.cache/cycles.I imagine deleting the
kernelsfolder inside this should help verify if this is the root cause.Interested to see if this fixes anything, as I am running into the same issues on my end with the same rig+OS.
It's strange, I found the folder with around 900 files and 350 MB of data. I moved all the data to a different location.
After starting Blender 4.0.2, nothing happens, no kernels are compiled and the render times are still bad with over 2 minutes. (workshop.blend)
With Blender 4.1 Alpha the kernels are compiled but no files are appearing in the folder, it's still empty.
The version 4.1 is still not able to render the image of workshop.blend at all or even the default cube for that matter.
Usually after installing blender and starting it for the first time, even the UI takes a while to appear because the MTL-Compiler is triggered too (I guess for the viewport?) This is not happening either at the moment.
I wonder now where the new kernel files are stored right now.
In the kernel folder is also a folder called "AMD_Radeon_Pro_5700_XT", which is my graphics card in the iMac.
Was Blender placing them there? And if yes, why don't they appear there again now after I moved them away to a different location?
I am confused.
And on my M1-MAX MBP there is a folder inside the kernels folder called "Apple_M1_Max", which makes sense, but where is this folder coming from? This is not a part of MacOS, right?
System Information
Operating system: Mac OS 12.6.9 (Intel i9 10940XE 14 Core 64 GB)
Graphics card 1: AMD Radeon RX 6950 XT 16 GB
Graphics card 2: AMD Radeon RX 6950 XT 16 GB
Blender Version
Worked: 3.6.0
Broken: 4.0.2 and 4.1 Alpha (18.12.)
Short description of error
There is a big regression on Cycles render time with AMD GPUs on macOS Monterey 12.6.9.
I get a 40% increase in render time in White Lands splash file in Blender 4.0.2 and 4.1.0 as well.
I get a 108% increase in render time in Scandlands splash file in Blender 4.0.2 and 120% in 4.1.0.
Blender 4.0.2 and Blender 4.1.0 are brand new. Vanilla setup, just activate in Metal both GPU.
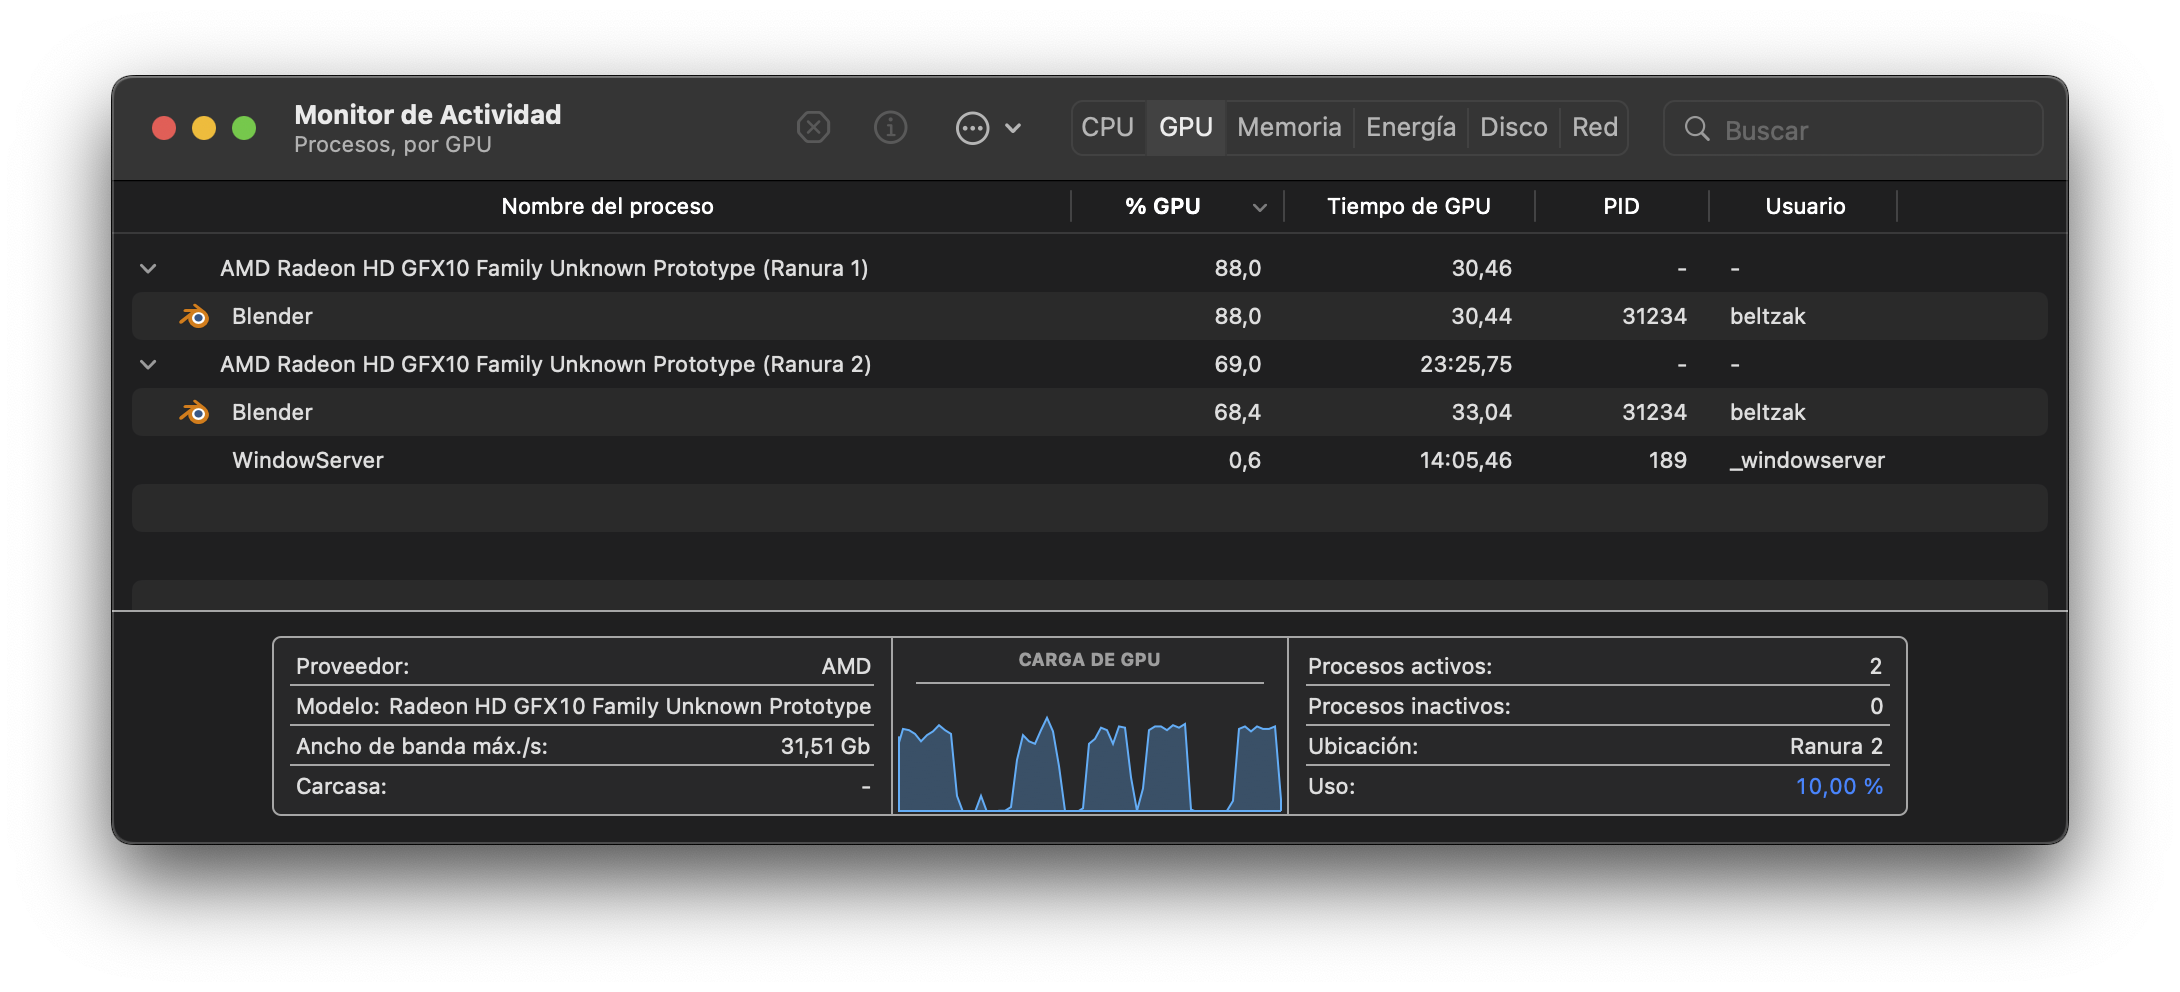
What I noticed with Activity Monitor in GPU 1 is that the main GPU the one connected to the monitor peaks in 42% of usage in Blender 4.0.2 and 4.1.0 and it barely loads over 35%. It's performance is very very low compared to Blender 3.6.0 which peaks around 70%. The second GPU 2 (no connected to any monitor) always performs very good in all test and versions.I took screenshots and tested several times each version and demos.
Exact steps for others to reproduce the error
Download Blender 3.2 – White Lands and Blender 3.3 LTS – Scanlands and hit render in all 3 versions of Blender.
Screenshots of Blender 3.6.0


Blender 3.6.0 GPU Render 1 min 46 sec Scanlands
Activity Monitor shows a peak 72% of use in GPU 1
Blender 3.6.0 GPU Render 40 sec White Lands

Activity Monitor shows a peak 72% of use in GPU 1 as well
Now check the difference between both GPU in Blender 3.6.0. rendering Scanlands .Is not very big.


Now the issue in Blender 4.0.2


Screenshots of Blender 4.0.2
Blender 4.0.2 GPU Render 3 min 41 sec Scanlands 108 percent increase in render time.
Blender 4.0.2 GPU 1 Activity Monitor Scanlands Peaks 42%
Blender 4.0.2 GPU Render 56 sec White Lands 40 percent increase in render time.


Blender 4.0.2 GPU 1 Activity Monitor White Lands Peaks 72 but overall the performance is way lower than in Blender 3.6.0 I am guessing that as it has 3 million triangles less the regression is way lower.
Now check the difference between both GPU in Blender 4.0.2 and 4.1.0 is pretty much the same even a bit worse. Is HUGE


In Blender 4.1.0.
Blender 4.1.0 GPU Render 3 min 52 sec Scanlands 120 percent increase in render time.
Blender 4.1.0 GPU Render 55 sec White Lands 40 percent increase in render time.
Not going to upload the screenshot because I think it would not clarify anything at this point.
I now Apple is focused in Apple Silicon systems but I hope you guys can fix the issue.
Thank you very much.
@DanielBrylka , #114875 might be related, can you check? (maybe you have ~4k/5k monitor?)
BTW, the performance regression that you reported earlier from 3.6-4.0 is not fixed on Mac+AMD, Brecht has disabled the code to improve the situation but performance remains bad when those nodes are used: #112596 / #113904
Hi, any updates?
Hi,
I am working with Blender 4.02 (with Metal CPU & GPU enabled and quite poor performance) at the moment and I have 4.1 and 4.2 installed from some days ago.
I am a bit lost with the different threads you mentioned, but I have time to test at the moment. Please tell me what I can do.
As I am using a 5k iMac I always have the 5k retina resolution enabled by default.
From version 4.1 onwards I am unable to use the AMD 5700 XT 16GB for rendering at all. I so simple not getting any image out of Blender anymore.
Black render. Exactly same issue as this.
#118466
4.0 won't receive any updates further and the empty/black render is already mentioned in #118466 so closing this ticket for now.
If performance regression persists after #118466 is fixed, we can reopen this or create a new report.